
Can we use copper put spreads as a hedge against a global recession?
With the help of the Allasso backtesting engine, we’re now talking copper as a hedge against a global recession, using options on copper futures.
Don’t worry, we’re not simply posturing as contrarians here. The potentially overextended copper price spike has presented an opportunity to play the downside.
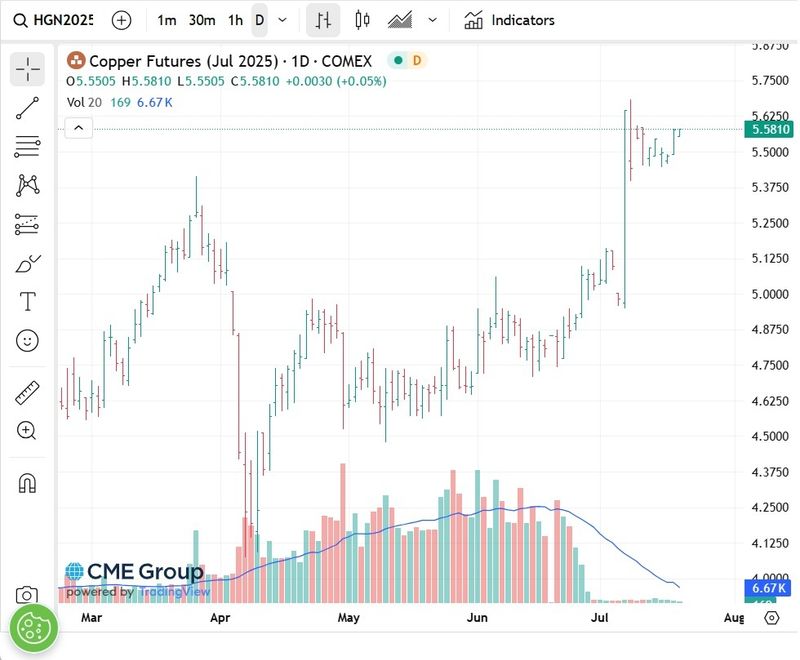
The recent Trump copper tariff announcement has caused COMEX (US) copper futures to rip higher (Figure 1). Note that the copper bulls were already out in force, given mega-high projected demand from data centres, green energy projects and the attempt to electrify the rest of the world.
Given deglobalisation threats and a strongly trending market, copper is a high-consensus long. New mines require major $ to be worthwhile and take many years to develop, and constraining future supply. For a variety of reasons, copper recycling takes place offshore.
We won’t focus on the fairly obvious relative value trade – long LME and short COMEX copper here – as it has received plenty of airplay elsewhere.
Using the price spike to increase hedge potency, if global growth disappoints
From a directional perspective, what can go wrong?
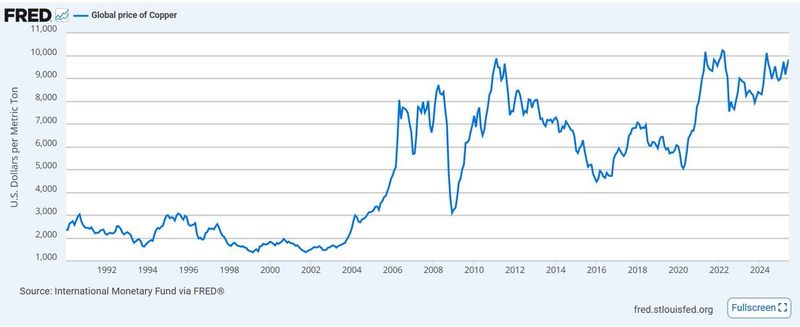
The bear case goes back to the old “Dr Copper” idea, which is borne out by historical data. Due to a drop in near-term demand, copper has gone into freefall during recessionary periods, for example between 2008 and 2020. The graph in Figure 2, taken from the St Louis Fed, tells the tale.
Can we use copper puts as a hedge against a global growth slowdown? Certainly, and we can set our put strikes quite high, given the recent price surge. However, as Figure 3 indicates, the implied volatility skew is extremely rich by historical standards.
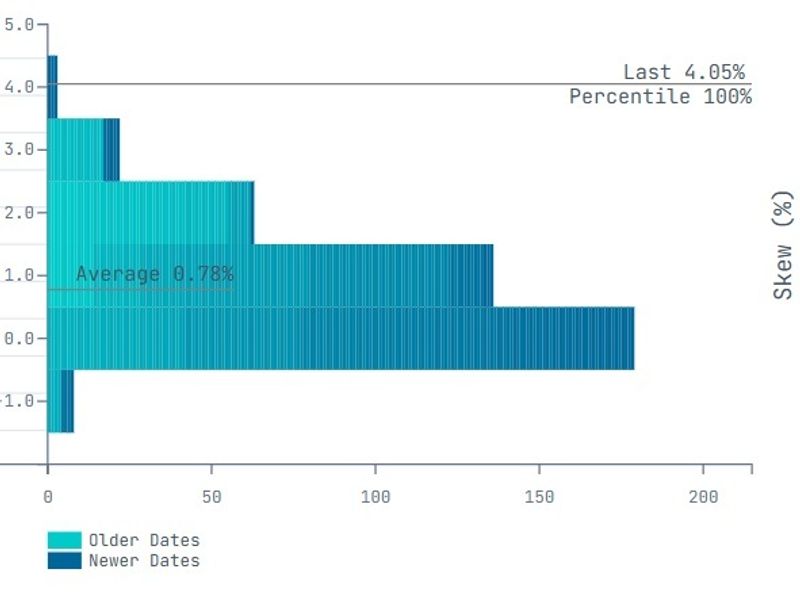
It’s not worth getting gouged from an implied volatility standpoint. We need a workaround.
In my book, The Second Leg Down, I argued for short S&P put ratio spreads as an equity hedge. These were delta and premium-neutral, yet could offer 1:1 coverage given a large drop in the index.
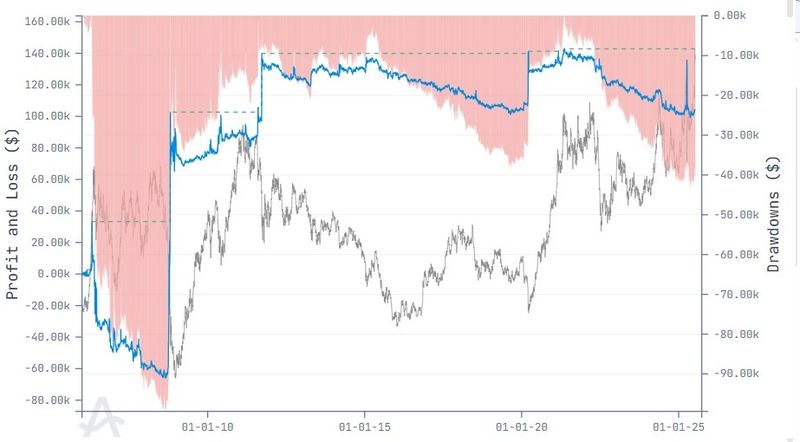
How does a copper “Second Leg Down” strategy look? The following graph, Figure 4, suggests a breakeven strategy over the market cycle, with significant pick-up during recessionary crises. Strategy returns in blue, rolling futures in grey.
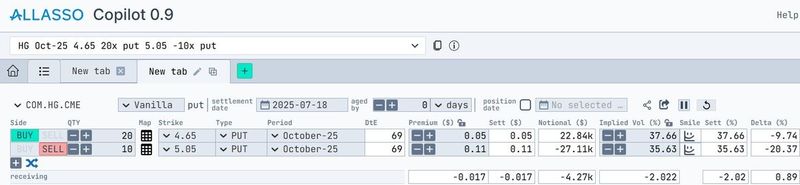
Here’s the position we would have had on 21 July (Figure 5), with a short 20 delta and 2X long 10 delta put to cover the downside. We haven’t eliminated the problem of cost, given the relatively high implied vol differential across the strikes, but reduced the damage greatly.
As ever, not to be construed as investment advice.